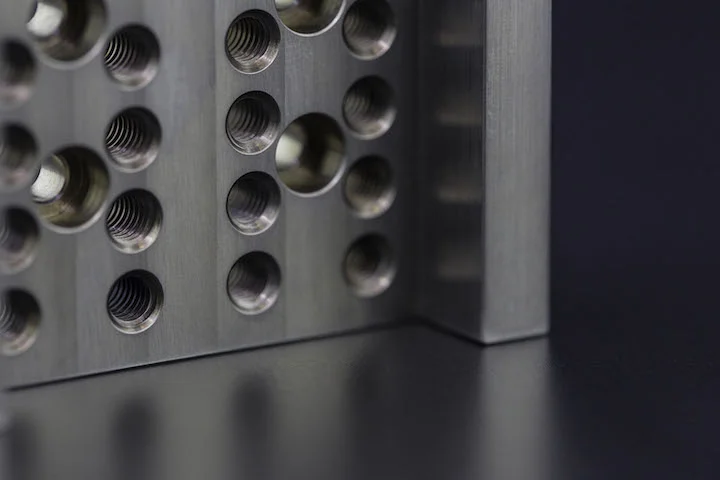


Surface finish charts serve as reference tools to ensure the quality and precision of surface treatment. Beyond physical properties like strength, ductility, or toughness, the surface defines a material’s overall appearance. A smooth surface finish enhances a material’s fatigue resistance and wearability, while roughness is essential for coating adhesion and friction applications.
Surface finish charts help you choose the most suitable and cost-effective methods to achieve the desired smoothness. This article presents various surface finish charts comparing surface roughness with processes, tools, and parameters.
Overview of Surface Finishing
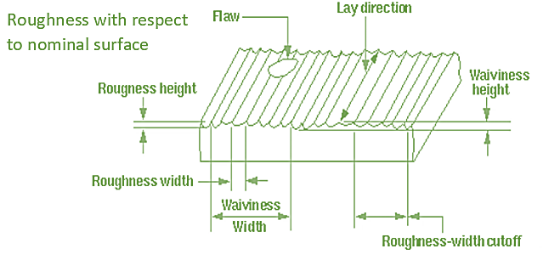
Surface finish, also known as surface topography or texture, describes a surface’s characteristics—such as roughness, waviness, and lay— which influence critical factors like wear resistance, friction, and adhesion.
Importance of Surface Finish Charts in Manufacturing and Engineering
These charts depict the average roughness profile of materials after different machining techniques (e.g., grinding, polishing, lapping). By reviewing them, you can make informed decisions about materials and processes to achieve the target surface roughness.
Benefits of optimal surface finish include improved performance, durability, and corrosion resistance. Textured surfaces can also enhance grip and reduce glare. However, drawbacks exist, such as increased machining costs, potential strength reduction from material removal, and higher corrosion risk in rough surfaces due to increased surface area.
Beyond process selection, these charts optimize workflows and cost efficiency. Standardized surface finish classifications also help maintain product quality.
How to Measure Surface Finish
Surface measurement techniques fall into two categories: comparative methods and non-contact methods. Common techniques for measuring surface roughness include:
Surface Profilometry
Used to measure the surface roughness and thickness of thin films. A diamond-tipped stylus traverses the sample surface to record topography.
Scratch Inspection
Involves moving a soft material (e.g., lead babbitt or plastic) over the sample surface to reveal scratch patterns.
Microscopic Imaging
The sample is viewed under a microscope, and its image is compared to reference surface finish images.
Visual Inspection
Suitable for high-surface-roughness values, but accuracy is limited. A lighted magnifier may be needed for lower roughness.
Inductive Measurement
A digital surface roughness meter generates output signals via inductance changes in a coil as a probe moves over the surface.
Laser Scanning
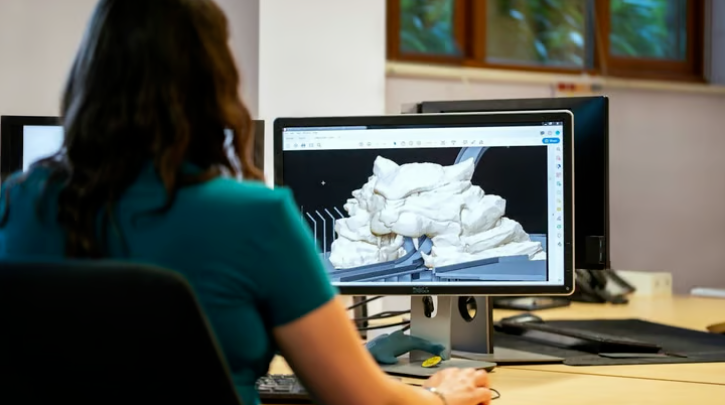
Uses laser confocal microscopes (contact or non-contact) for horizontal axis measurements and 3D modeling via distance imaging.
Ultrasonic Testing
Ultrasonic sensors measure surface roughness by analyzing changes in incident and reflected sound waves due to surface texture.
Classification of Surface Finish Charts
Machined Surface Finish Chart
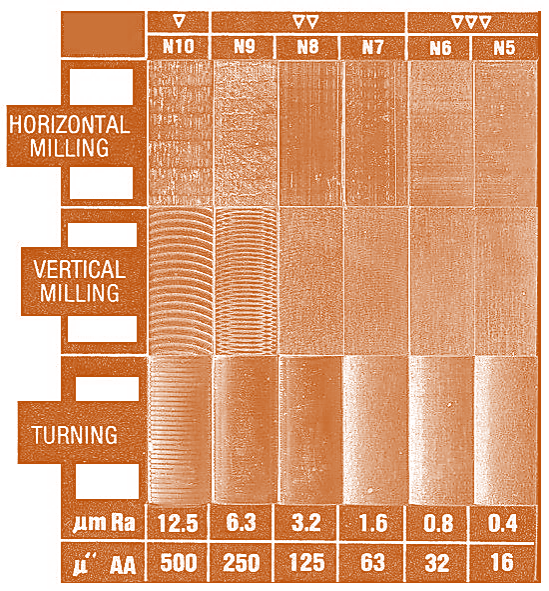
Processes like grinding, milling, turning, or drilling yield different surface roughness values on specific materials. This chart compares the average roughness from each process to help select the optimal method for desired roughness.
| Finish Grade (China) | Ra (μm) | Rz (μm) | Ra (μin) | Machining Method |
|---|---|---|---|---|
| 1 | 50 | 200 | 2000 | Rough casting or coarsest machining |
| 2 | 25 | 100 | 1000 | Rough turning, boring, planing, drilling (obvious machining marks) |
| 3 | 12.5 | 50 | 500 | Same as Grade 2 finish |
| 4 | 6.3 | 25 | 320/250 | Normal turning, boring, planing, drilling, grinding (marks visible) |
| 5 | 3.2 | 12.5 | 200/160 | Same processes as Grade 4 (slightly visible marks) |
| 6 | 1.6 | 6.3 | 100/80 | CNC turning, boring, planing, drilling, grinding (marks invisible, direction clear) |
| 7 | 0.8 | 6.3 | 50/40 | Same processes as Grade 6 (direction faint) |
| 8 | 0.4 | 3.2 | 25/20 | Reaming, grinding, boring, rolling (smooth surface, faint direction) |
| 9 | 0.2 | 1.6 | 12.5/10 | Grinding, superfinishing (marks and direction invisible) |
| 10 | 0.1 | 0.8 | 4 | Advanced superfinishing (highest gloss) |
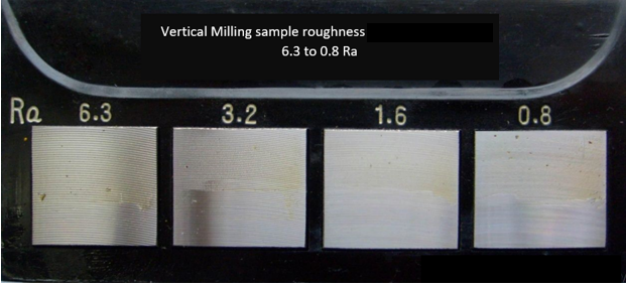
Milling Surface Finish Chart
Focused on milling processes, this chart compares average roughness from different cutting tools, speeds, and feed rates to optimize milling workflows.
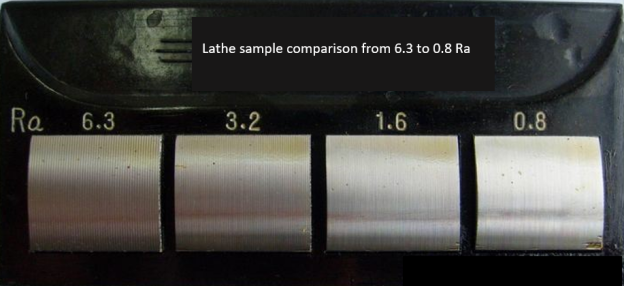
Lathe Surface Finish Chart
Shows roughness ranges for different materials and cutting parameters, aiding machinists and engineers in selecting optimal lathe settings.
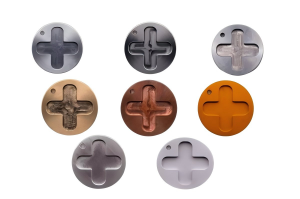
Plastic Surface Finish Chart
Compares finish types, roughness ranges, and costs for plastics. For example:
| Polymer | A1 (High Gloss) | A2 | A3 |
|---|---|---|---|
| ABS | Fair | Fair | Good |
| Polypropylene (PP) | Poor | Fair | Fair |
| Polystyrene (PS) | Fair | Fair | Good |
| HDPE | Poor | Fair | Fair |
| Nylon | Fair | Fair | Good |
| Polycarbonate (PC) | Fair | Good | Excellent |
| Polyurethane (TPU) | Poor | Poor | Poor |
| Acrylic | Excellent | Excellent | Excellent |
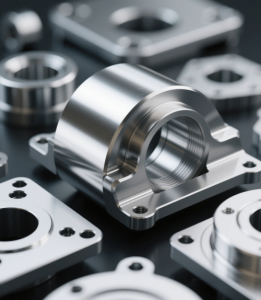
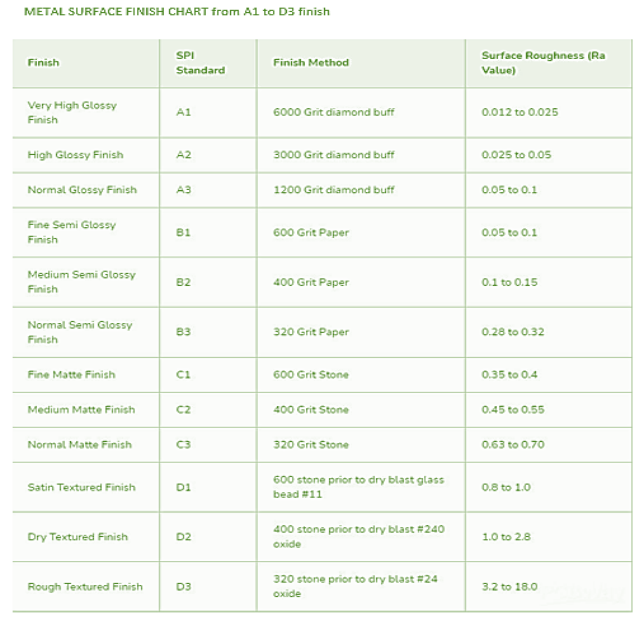
Metal Surface Finish Chart
Summarizes roughness after processes like grinding and milling for different metals, aiding process optimization.
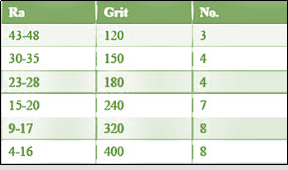
Stainless Steel Surface Finish Chart
Shows average roughness, grit size, and polish grade (1–8, where 1 is unpolished and 8 has the lowest roughness), achieved using abrasive belts.
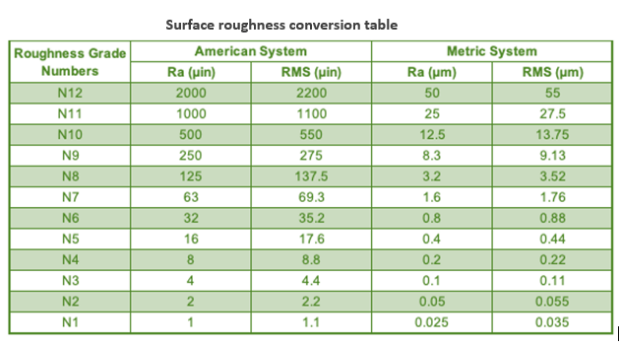
Surface Finish Conversion Chart
Converts between units like Ra (μm/μin), RMS, CLA, Rt, and ISO grades:
| N | Ra (μm) | Rz (μm) | CLA (μin) | RMS (μin) | Cutoff Length |
|---|---|---|---|---|---|
| 1 | 0.3 | 0.025 | 1 | 1.1 | 0.003″/0.08mm |
| 2 | 0.5 | 0.05 | 2 | 2.2 | 0.01″/0.25mm |
| 3 | 0.8 | 0.1 | 4 | 4.4 | 0.01″/0.25mm |
| 4 | 1.2 | 0.2 | 8 | 8.8 | 0.01″/0.25mm |
| 5 | 2.0 | 0.4 | 16 | 17.6 | 0.01″/0.25mm |
| 6 | 4.0 | 0.2 | 32 | 35.2 | 0.03″/0.8mm |
| 7 | 8.0 | 1.6 | 63 | 64.3 | 0.03″/0.8mm |
| 8 | 13 | 3.2 | 125 | 137.5 | 0.1″/2.5mm |
| 9 | 25 | 6.3 | 250 | 275 | 0.1″/2.5mm |
| 10 | 50 | 12.5 | 500 | 550 | 0.1″/2.5mm |
| 11 | 100 | 25 | 1000 | 1100 | 0.3″/8.0mm |
Factors Affecting Surface Finish
- Cutting Tool Material: HSS tools yield rougher surfaces, while carbide and ceramic tools produce smoother finishes.
- Material Hardness: Closer hardness to the tool increases roughness; a larger hardness gap yields smoother surfaces.
- Machining Parameters: Adjust cutting speed, depth, feed rate, and material removal rate to control roughness.
- Lubrication and Cooling: Reduces friction, prevents tool damage, and enhances finish.
- Post-Processing: Additional steps like chemical treatment, grinding, or polishing refine the surface.
Surface Roughness Conversion Formulas
Surface Finish Inspection
Use profilometers or techniques like confocal laser scanning to measure roughness via stylus traversal or non-contact methods.
Conclusion
Surface finish is more than aesthetic—it enhances fatigue resistance and functionality. This article covers various charts to help you understand roughness ranges for different processes and tools.
Debaolong Seiko’s CNC expertise offers surface finishing solutions via material removal (e.g., grinding, polishing) or coating addition (e.g., sandblasting, anodizing, electroplating, powder coating, black oxide, alodine). Contact us to optimize your surface finishing needs.